Bit Selection on Offshore Campaign
Drilling performance analysis is a fundamental step in continuous operations improvement (activities acceleration and reduction of Non Productive Time, selection of best equipment/technology) and for the increase of accuracy in future wells planning. As such, this step is primarily based on daily drilling reporting (DDR) compiled by Company Men on rig sites.
This kind of reports has three limits:
- DDR are influenced by human bias
- DDR doesn’t highlight real activity duration (such as real bit on bottom hours) and calculate accurate KPI
- Comparing qualitative and quantitative data is time-consuming
ID3 has the solution to solve these limits, indeed ID3 is able to automatic combine different sources of data to increase the accuracy and resolution of the time analysis.
The following chart shows how all the data are merged, and qualitative and quantitative parameters are combined. Qualitative data recorded in the daily reporting let to identify the main characteristics of the bits, give information regarding the wearing at the pull out, and can be analysed together with effective drilling parameters or KPI (evaluated thanks to rig sensor data analysis) such as weight on bit, rotation per minutes or hours bit on bottom.
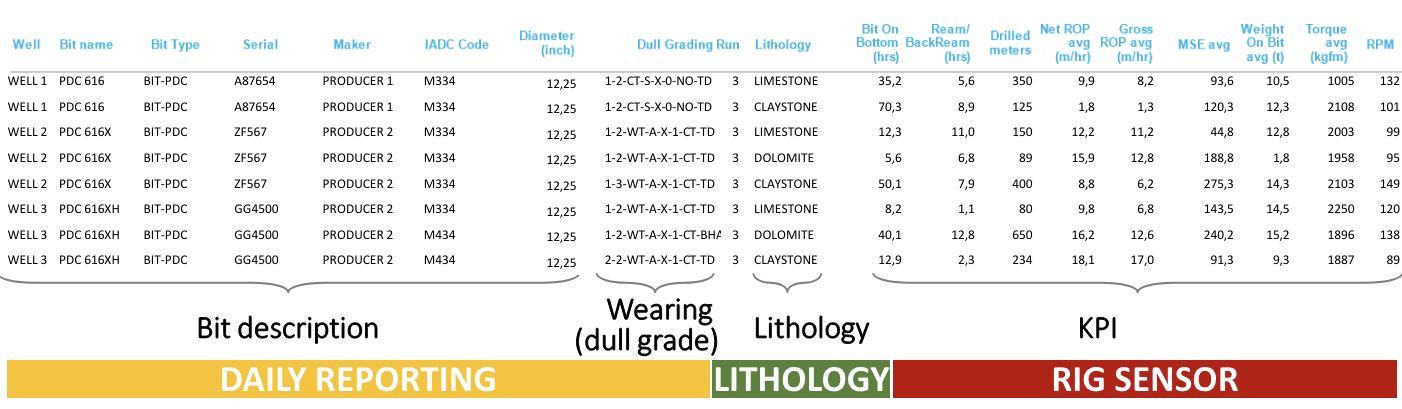
Such analysis can be performed for each drilled section, and also for each crossed lithology: this allows to have all the information to select the best equipment (in terms of features/producer) for the next wells and the best parameters to use according to the lithology to be drilled. All the data are measured on real wells and reflects the real operating modes/procedures. The analysis can focus on the most drilled lithologies for each section.
A detailed analysis of bit performance for each phase and for each lithology drilled has been performed on an offshore drilling campaign, comparing average net ROP bit on bottom. This value is calculated directly by rig sensor data and does not encompasses any reaming, back-reaming, circulation or time for connection.
This approach has been applied to the 17½’’, 12¼’’ and 8½’’ sections. Bit analysis, based on lithology, highlighted:
A good choice both of bit type and drilling parameters applied. Moreover some further improvement could be possible considering vibration effects probably occurred during 12” ¼ and 8” ½ (Chipped teeth evidences on bit dull).
The main results for the three sections are reported in the following graphs.
17 ½’’
Net ROP has increased in Well 3 in all lithologies reaching over 35 m/hr in each lithology. Bit selection is confirmed for 17 ½’’ phase, PDC with 6 blades and 19 mm cutters. The main crossed lithology is limestone, during the drilling of this lithology the average weight on bit has increased from 7 tons in Well 2, to 10 tons in Well 3, also the number of rotation per minutes has increased up to 183 RPM. The optimization of these drilling parameters has led to a doubling of net (bit on bottom) rate of penetration.
12 ¼’’
The trend of ROP increasing is confirmed also in 12 ¼’’ phase. Some differences in the lithology can be observed for this phase from Well 1 to Well 2 and Well 3. In the first well the main lithology is the Dolomitic Limestone, instead in the last two wells the phase is characterized by claystone, the different performance of the bit could be due to the different hardness of the lithologies. For Well 3 a different bit Maker has been selected, maintaining the choice of PDC with 6 blades and 16 mm cutters. As regards the outer cutting structure of the dull grade, this choice gained a point in the scale, but the bit still present chipped cutters that could mean a suboptimal drilling.
8 ½’’
The main lithology drilled during 8 ½ ‘’ phase is Limestone for Well 1 and 2, instead in Well 3 is a Dolomitic Limestone. In the Limestone Lithology, average net ROP increases changing bit Makers, all the three are PDC bits with 6 blades and 16 mm cutters, but one Maker provided an additional row of backupcutters and the other one a bit with 50 series nozzles, back reaming cutters and diamondenhanced gauge protection. For the overall phase the performance of Well 2 and 3 are similar, average net ROP is around 12 m/hr, but BHA design could be improved to minimized chipped cutters and consequentially increase drilling efficiency.