Case study
Learning Curve with ID3
The innovative approach of ID3 (Integrated Drilling Data Discovery) applied to evaluate a drilling campaign is based on an automatic combination of two sources of information: Daily Drilling Reporting (DDR) compiled by Company Men on rig sites and surface logging data automatically recorded and interpreted.
The innovative approach of ID3 (Integrated Drilling Data Discovery) applied to evaluate a drilling campaign is based on an automatic combination of two sources of information: Daily Drilling Reporting (DDR) compiled by Company Men on rig sites and surface logging data automatically recorded and interpreted.
This approach avoid any bias and increase granularity of the analysis and as a consequence its accuracy.
The output is supporting both ongoing operations and future wells planning, by:
- Measuring the non productive times
- Measuring the sub-optimal performance
- Calculating a full set of main drilling indicators (ROP, tripping speed, circulation time, etc.)
First step is NPT analysis: starting from a simple and comprehensive analysis (as shown in the graph on the right) a more advance analysis can be performed, measuring the impact and frequency of occurrence of different type of NPT.
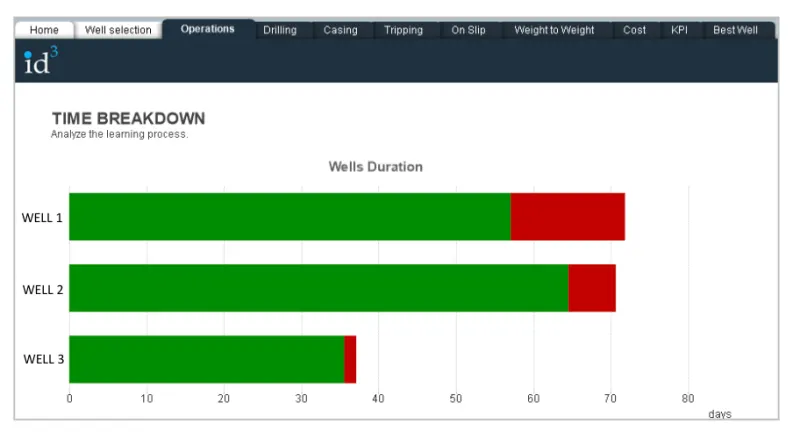
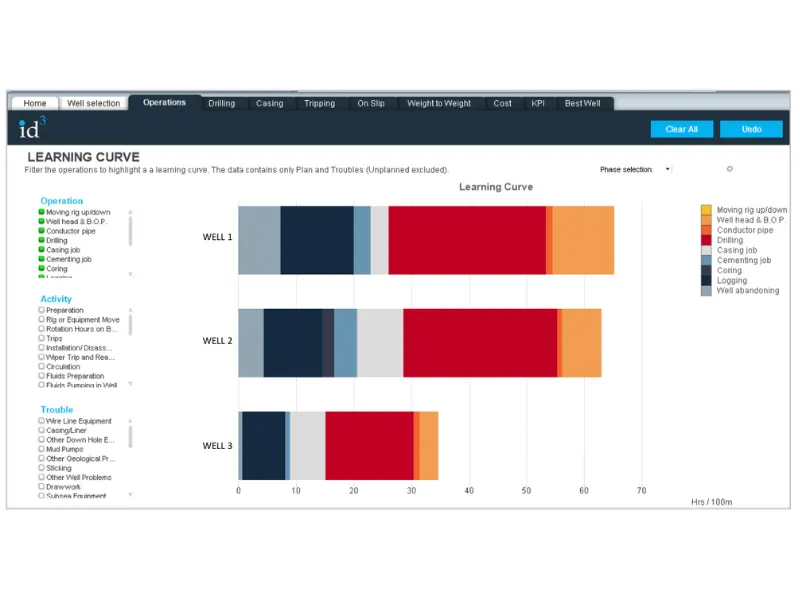
The following graph shows how the learning process can be automatically and intuitive analysed for the selected Operation and Activity, in order to highlight potential for improvement or verify the performance during the campaign (for example following the implementation of a specific procedure or the introduction of a new technology).
The following chart summarizes the learning process in a offshore campaign, comparing its performance, measured on main KPIs, to the average of the previous wells. All these values are directly available in ID3.
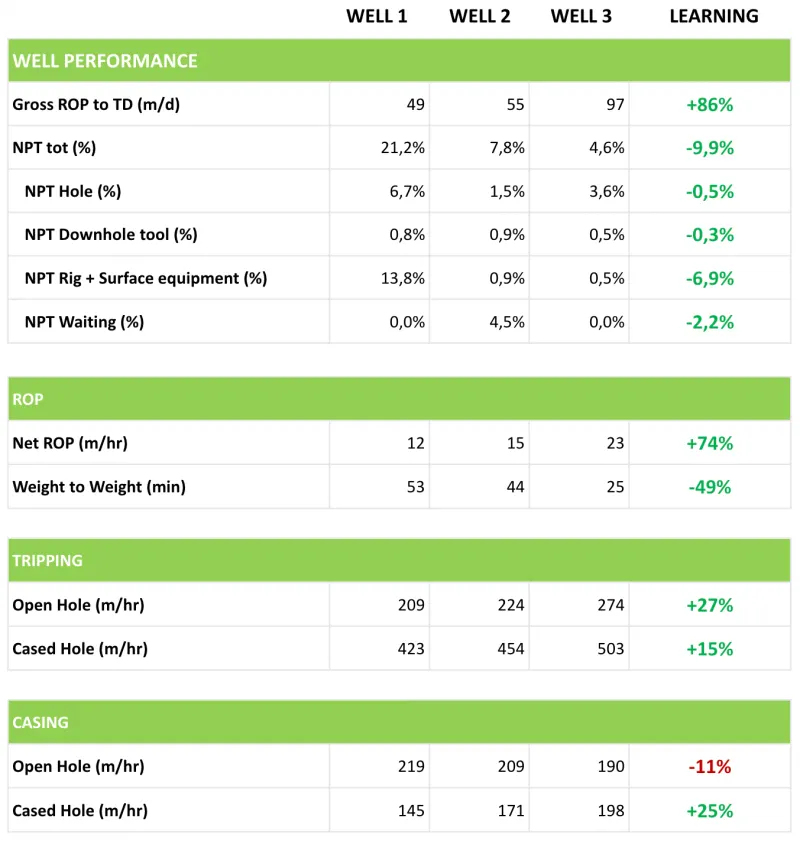
The analysis shows an evident learning process among the three wells due to both ROP improvement, trip time reduction and flat time reduction during drilling.