Rig Performance

During long drilling campaigns the increase of the performance is fundamental: all the operations have to be optimized in order to reduce time and cost as much as possible.
Standard performance evaluation is based on macro kpi (drilling ROP, flat time duration,..), instead higher the accuracy of the time analysis, higher could be the potential for improvements. The innovative way to measure operations performance is through mud logging data interpretation, avoiding any bias and increasing granularity of the analysis. This last approach is focused on a set of automatically detectable operations (tripping, drilling, circulating, reaming, on slip,..) that already covers around 60-70% of overall drilling time.
By using ID3, the activities are detected with an higher granularity and then it’s possible to perform an in-depth analysis in order to boost the performance.
An example is regarding the Rig performance. There are some KPIs that depends only on crew performance and not on well design or geological conditions, such as:
- Cased hole tripping speed
- Connection time
These KPIs can be measured both during tripping and casing operations.
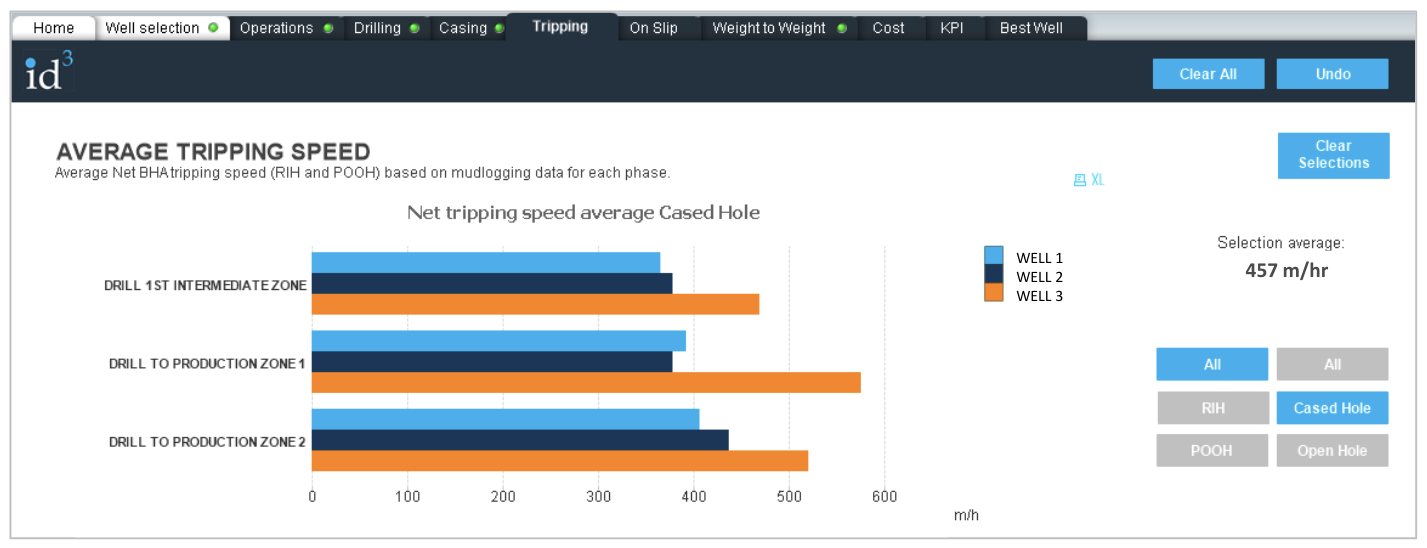
The following figure shows a detail of the tab “Tripping” of ID3.

Through intuitive selections, ID3 allows to analyse overall tripping performance focusing on RIH (Run In Hole) or POOH (Pool Out Of Hole) operations in Cased Hole or Open Hole.
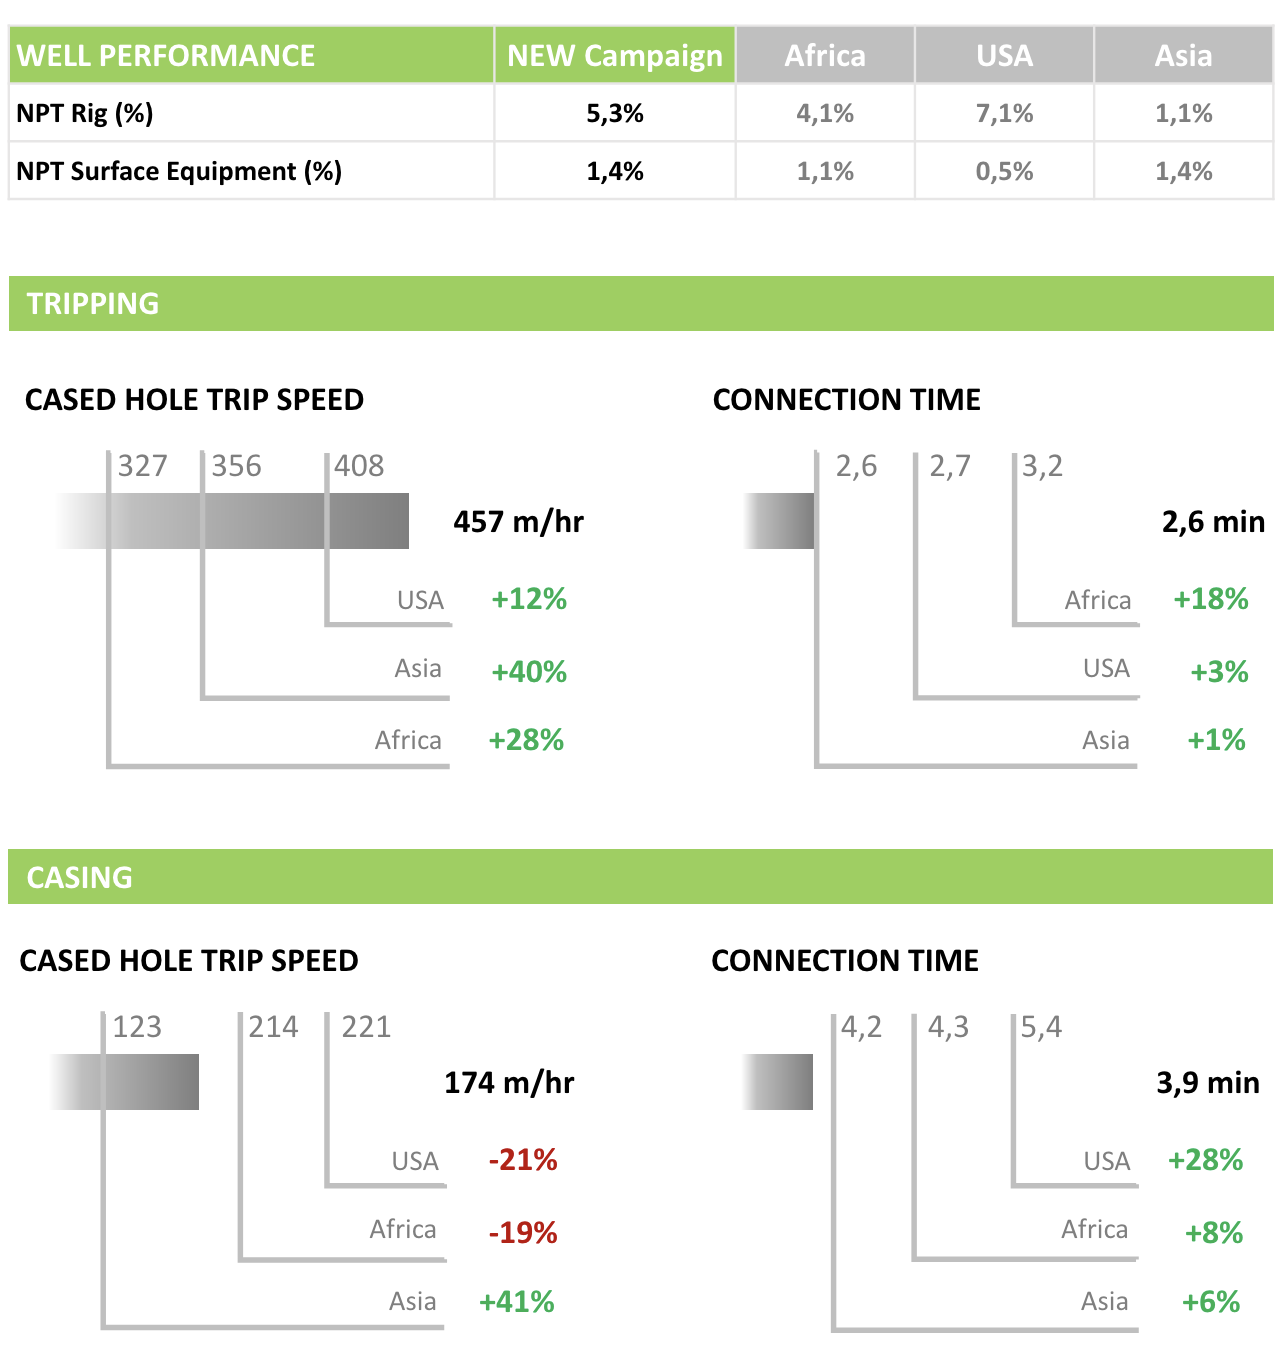
The following graphs summarize the main results of the analysis of a drilling ship performance compared to three similar campaigns in Asia, Africa and USA.

During the campaign under evaluation, the percentage of rig dependent NPT is increased compared with previous campaign, except regarding rig NPTs of USA campaign.
Tripping performance (considering both cased hole tripping and connection time) are increasing; time spent on connections is decreasing highlighting a learning effect in crew performance.

